

Earnings recovery in Q2 despite substantial cost headwinds
-
Q2 spot rates and volumes significantly above Q1 levels
-
Gemini network with superior reliability despite operational challenges
-
Terminal & Infrastructure business growing and increasingly strategically relevant
-
Full-year earnings outlook raised in July on improved market fundamentals
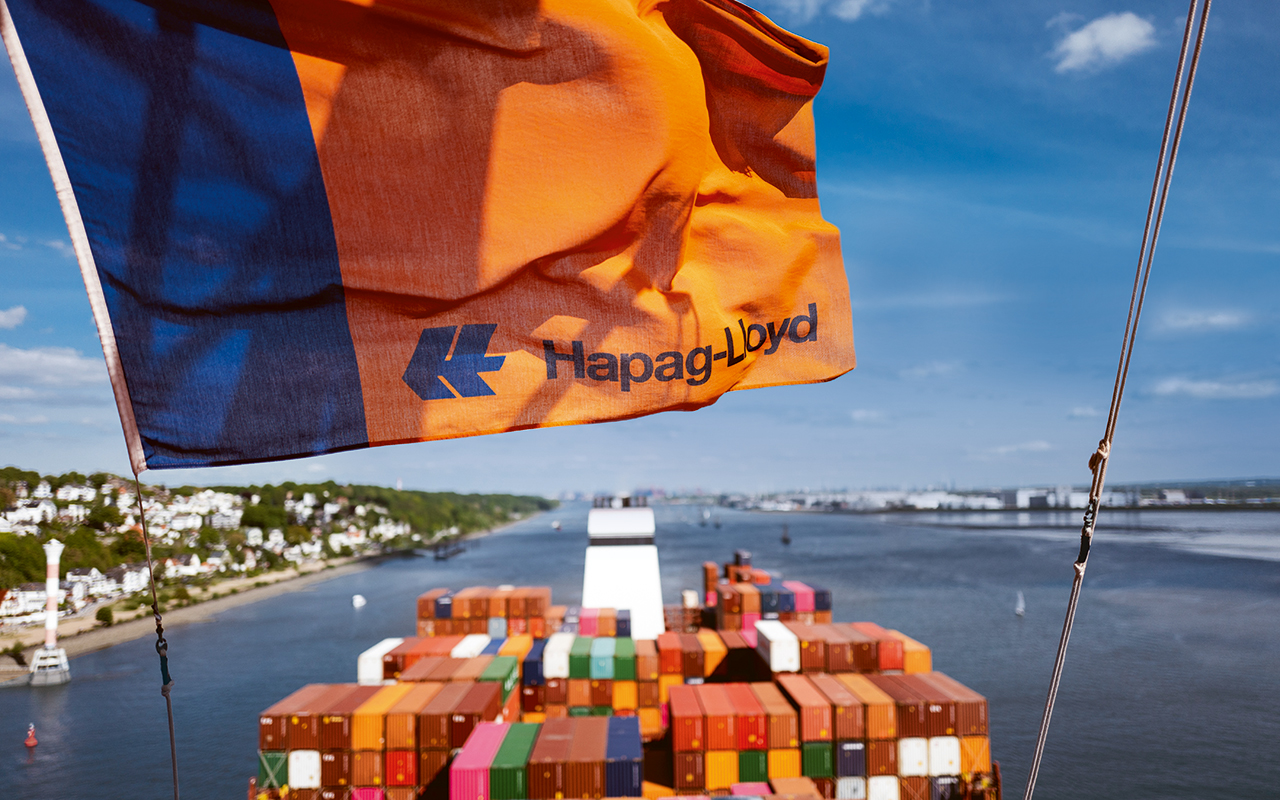
Hapag-Lloyd concluded the second quarter of 2026 with a slightly higher Group EBITDA of USD 829 million (EUR 712 million) compared to the prior-year quarter. Group EBIT declined to USD 176 million (EUR 150 million), while Group profit decreased to USD 83 million (EUR 71 million). Following an unsatisfactory start to 2026, with earnings impacted by operational disruptions, volumes and spot rates picked up significantly in the second quarter. This positive development was mainly driven by strong exports out of Asia and improved US demand, which helped offset the significant cost headwinds of around USD 600 million in Q2 arising from the conflict in the Middle East.
In the Liner Shipping segment, revenues reached USD 5.7 billion (EUR 4.9 billion) in the second quarter of 2026, supported by higher transport volumes of 3.5 million TEU (Q2 2025: 3.4 million TEU). The average freight rate increased by 9% year over year to USD 1,475 per TEU (Q2 2025: USD 1,354 per TEU). EBITDA declined to USD 773 million (EUR 664 million), while EBIT fell to USD 153 million (EUR 131 million), primarily because the blockage of the Strait of Hormuz resulted in additional costs for bunker, insurance, storage, service rerouting, and inland transportation.
In the Terminal & Infrastructure segment, revenues increased to USD 191 million (EUR 165 million) in the second quarter of 2026, driven by the first-time full consolidation of J M Baxi’s container business and strong volume growth in Latin America. EBITDA rose to USD 55 million (EUR 47 million), while EBIT amounted to USD 21 million (EUR 18 million).
“The second quarter was better than the first, driven by significantly higher spot rates and robust demand. Our Gemini network remained resilient and continued to outperform the market, setting the industry benchmark for schedule reliability. Additionally, the terminal business continues to grow and is becoming increasingly strategically relevant, supported by strong throughput and investment in new assets. In the second half of 2026, we will remain focused on growing both our liner shipping and terminal businesses while maintaining strict cost discipline to further improve our financial performance,” said Rolf Habben Jansen, CEO of Hapag-Lloyd AG.
On the back of the Q2 performance and the improved market, the full-year 2026 earnings outlook was raised on July 13. Group EBITDA is expected to be in the range of USD 2.7 billion to USD 3.7 billion (EUR 2.3 billion to EUR 3.2 billion) and Group EBIT to be in the range of USD 0.1 billion to USD 1.1 billion (EUR 0.1 billion to EUR 1.0 billion). This outlook remains subject to considerable uncertainty due to the highly volatile development of freight rates and the conflict in the Middle East.
The financial report for the first half of 2026 is available here:
https://www.hapag-lloyd.com/en/company/ir/publications/financial-report.html
KEY FIGURES (USD)*
| Q2 2026 | Q2 2025 | H1 2026 | H1 2025 | H1 2026 versus H1 2025 |
|
| Group | |||||
| Revenues (USD million) | 5,840 | 5,272 | 10,759 | 10,590 | 169 |
| EBITDA (USD million) | 829 | 820 | 1,323 | 1,924 | -601 |
| EBIT (USD million) | 176 | 189 | 18 | 677 | -658 |
| EBITDA margin | 14.2 | 15.6 | 12.3% | 18.2% | -5.9 pp |
| EBIT margin | 3.0 | 3.6 | 0.2% | 6.4% | -6.2 pp |
| Group profit (USD million) | 83 | 306 | -173 | 775 | -948 |
| Liner Shipping Segment | |||||
| Transport volume (TTEU) | 3,481 | 3,362 | 6,684 | 6,588 | 96 |
| Freight rate (USD/TEU) | 1,475 | 1,354 | 1,406 | 1,411 | -5 |
| Revenues (USD million) | 5,682 | 5,166 | 10,461 | 10,386 | 75 |
| EBITDA (USD million) | 773 | 777 | 1,220 | 1,844 | -624 |
| EBIT (USD million) | 153 | 167 | -21 | 639 | -660 |
| Terminal & Infrastructure Segment | |||||
| Revenues (USD million) | 191 | 135 | 360 | 244 | 115 |
| EBITDA (USD million) | 55 | 44 | 102 | 79 | 23 |
| EBIT (USD million) | 21 | 22 | 39 | 37 | 2 |
KEY FIGURES (EURO)*
| Q2 2026 | Q2 2025 | H1 2026 | H1 2025 | H1 2026 versus H1 2025 |
|
| Group | |||||
| Revenues (EUR million) | 5,020 | 4,633 | 9,221 | 9,685 | -464 |
| EBITDA (EUR million) | 712 | 711 | 1,134 | 1,759 | -626 |
| EBIT (EUR million) | 150 | 156 | 16 | 619 | -603 |
| Group profit (EUR million) | 71 | 263 | -148 | 709 | -857 |
| Liner Shipping Segment | |||||
| Revenues (EUR million) | 4,885 | 4,540 | 8,966 | 9,499 | -533 |
| EBITDA (EUR million) | 664 | 673 | 1,046 | 1,686 | -641 |
| EBIT (EUR million) | 131 | 136 | -18 | 585 | -602 |
| Terminal & Infrastructure Segment | |||||
| Revenues (EUR million) | 165 | 120 | 308 | 223 | 85 |
| EBITDA (EUR million) | 47 | 39 | 88 | 72 | 15 |
| EBIT (EUR million) | 18 | 20 | 33 | 34 | -1 |
* In individual cases, rounding differences may occur in the tables for computational reasons.